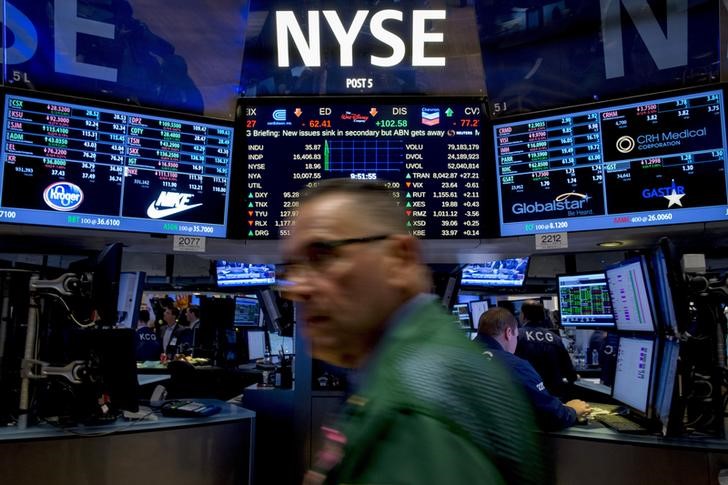
(Bloomberg) -- The world of exchange-traded products is in shock, with trading suspended for securities that handed investors handsome returns in the past two years. Large speculators, by contrast, have been preparing for the return of choppy market conditions.
After cutting bets against Cboe Volatility Index futures for most of the weeks since the end of last year, they pushed the number of shorts outstanding to the fewest since November 2016, the latest data from the U.S. Commodity Futures Trading Commission show. The VIX surged as much as 35 percent on Tuesday and traded at 49.21 as of 7:52 a.m. in New York, a level that would mark its highest since the 2009 stock-market bottom if held through the close.
Though it’s likely few investors foresaw the maelstrom, they held record short wagers as recently as October as the volatility index headed for an all-time low the following month. For those with a glass-half-full disposition, the positioning data suggest Monday’s equity pain could have been a lot worse.
2017 was tough for anyone wagering on market turmoil as equity volatility kept on sinking, and traders turned their focus to the opposite strategy: going short volatility. That led to surges in the VelocityShares Daily Inverse VIX Short-Term ETN and ProShares Short VIX Short-Term Futures ETF, which almost tripled in value.
The move among hedge funds and large speculators to pare short exposures now looks foresighted. By contrast, the two securities saw inflows last week, including a record day for the VelocityShares note, known by its ticker XIV.
Their future is now uncertain, after plunges in the past two days, and both were halted on Tuesday pending news.
Here’s where volatility stands for major global indexes:
- The S&P 500’s 30-day, at-the-money implied volatility of 23.4 as of the last close was 3.6 points above realized, and in the 100 percentile over the past year
- The Dow’s implied volatility of 20.9 traded 1.6 points below realized
- For the Nasdaq 100 and Russell 2000, implied volatility was around 26, about 6 points higher than historical
- Euro Stoxx 50: 25 IV, 11.6 points above
- Nikkei 225: 27.1 IV, 4.1 points above
- Hang Seng: 25.2 IV, 0.5 points above; HSCEI: 31.1 IV, 0.8 points below realized
- Nifty 50: 17.9 IV, 4.2 points above
(Updates with VIX move in second paragraph, Euro Stoxx volatility data in bullets.)
