
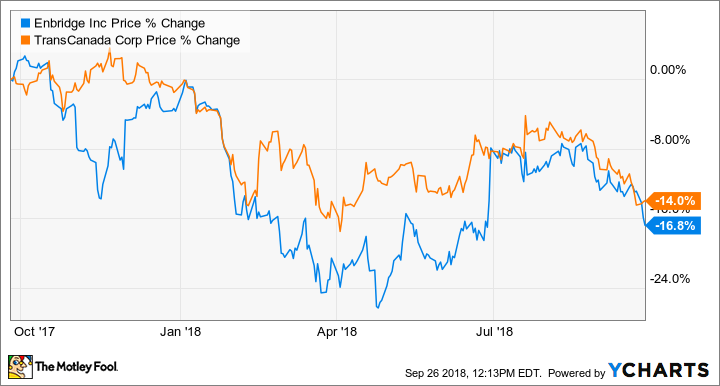
In the last 12 months, both Enbridge (TSX:ENB)(NYSE:ENB) and TransCanada (TSX:TRP)(NYSE:TRP) stocks have declined by about 14% or more. Pullbacks like these are a good reason to consider picking up shares of these proven dividend-growth stocks.
Let’s compare the two to see which may be a better buy today.
Dividend safety
At about $42.50 per share as of writing, Enbridge offers a dividend yield of about 6.3%. Based on its distributable cash flow per share of $2.47 year to date and a quarterly dividend per share of $0.671, Enbridge’s payout ratio is about 55%.
At about $53.40 per share as of writing, TransCanada offers a dividend yield of about 5.2%. Based on its distributable cash flow per share of $3.08 year to date and a quarterly dividend per share of $0.69, TransCanada’s payout ratio is about 45%.
Based on the payout ratio, TransCanada offers a safer dividend.
Dividend growth in the past and into the future
Enbridge has increased its dividend per share for 22 consecutive years with a three-, five-, and 10-year dividend-growth rate of 19.9%, 16.4%, and 14.6%.
Enbridge has visible growth through 2020 with $22 billion of growth projects coming into service between this year and 2020. Management believes the projects will support average dividend growth of 10% from 2018 to 2020.
TransCanada has increased its dividend per share for 17 consecutive years with a three-, five-, and 10-year dividend-growth rate of 9.2%, 7.3%, and 6.3%.
TransCanada has $28 billion of near-term capital projects. Combined with the organic growth from its existing business, it aims for annual dividend growth of 8-10% through 2021.
Investors should be able to get greater dividend returns from Enbridge based on management’s dividend-growth targets for the next few years.
Valuation
The analyst consensus from Thomson Reuters has a 12-month target of $53.10 per share on Enbridge, which represents about 25% near-term upside potential. The consensus has a 12-month target of $67.60 per share on TransCanada, which implies a near-term upside of nearly 27%. So, TransCanada seems to be slightly cheaper.
Balance sheet strength
Both Enbridge and TransCanada have an investment-grade credit rating of BBB+.
At the end of the second quarter, Enbridge had a debt ratio of 0.56 (defined by total assets divided by total liabilities). It had about $60 billion of long-term debt, while it’s estimated to generate about $13 billion of operating cash flow on an annualized basis.
At the end of the second quarter, TransCanada had a debt ratio of 0.68. It had about $41.9 billion of long-term debt, while it’s estimated to generate about $6.4 billion of operating cash flow on an annualized basis.
These metrics indicate that Enbridge has a stronger balance sheet.
Investor takeaway
From a total returns perspective, investors can potentially get a slightly higher return of about 32% over the next 12 months in TransCanada versus a return of about 31% in Enbridge. In terms of which company you should buy today, it depends on which of the discussed factors you care more about.
Fool contributor Kay Ng owns shares of Enbridge and TransCanada. Enbridge is a recommendation of Stock Advisor Canada.