Both Enbridge (TSX:ENB)(NYSE:ENB) and TransCanada (TSX:TRP)(NYSE:TRP) are undervalued. Which pipeline company is a better buy right now?
Let’s compare the two.
Which is cheaper? At about $45.70 per share as of writing, Enbridge trades at a blended price-to-operating-cash-flow ratio (P/OCF) of about 7.3. It’s trading at a meaningful discount of about 26% from its normal multiple.
Thomson Reuters has a mean 12-month target of $52.90 per share on Enbridge, which represents about 16% near-term upside potential.
Image source: Getty Images.
At about $53.40 per share as of writing, TransCanada trades at a blended P/OCF of roughly 7.5. It’s trading at a decent discount of about 17% from its normal multiple.
Reuters has a mean 12-month target of $63.50 per share on TransCanada, which represents almost 19% near-term upside potential.
So, from a cash flow multiple perspective, Enbridge is a cheaper stock with greater near-term upside potential. However, based on the analyst consensus from Reuters, TransCanada has greater near-term upside.
Comparing their dividends and dividend growth At $45.70 per share, Enbridge offers a yield of nearly 6.5%. It has increased its dividend per share for 23 consecutive years with a three-year dividend-growth rate of 13%. Its 2019 payout ratio is estimated to be about 66% of distributable cash flow.
Enbridge’s quarterly dividend per share paid out in the last four quarters was 11.2% higher than it was in the previous four quarters. Enbridge just increased its quarterly dividend per share by 10% year over year, and it aims to increase the dividend by 10% again next year.
Enbridge estimates that its distribution cash flow per share growth will increase by about 5-7% per year after 2020. So, investors should be prepared for slower dividend growth perhaps in the 8% range after 2020.
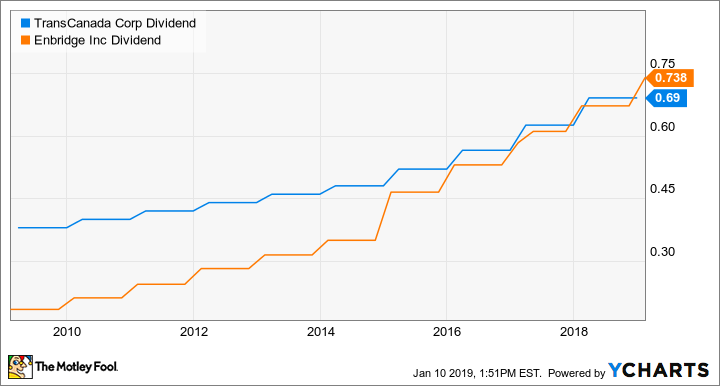
TRP Dividend data by YCharts. 10-year dividend growth of ENB and TRP.
At about $53.40 per share, TransCanada offers a yield of about 5.2%. It has increased its dividend per share for 18 consecutive years with a three-year dividend-growth rate of 9.9%. Its recent payout ratio was about 45% of distributable cash flow.
TransCanada’s quarterly dividend per share paid out in the last four quarters was 10.4% higher than it was in the previous four quarters. TransCanada aims to increase its dividend per share by 8-10% through 2021.
Investor takeaway Both Enbridge and TransCanada are discounted and have an S&P credit rating of “BBB+.” They are great income investments that will continue increasing their dividends that are at least double the rate of inflation.
Enbridge has a debt-to-equity ratio of 1.11, which is better than TransCanada’s ratio of 1.76. So, it may be worthwhile to buy Enbridge, which offers a bigger yield for greater periodic returns from the dividend every quarter.
Fool contributor Kay Ng owns shares of Enbridge and TRANSCANADA CORP. Enbridge is a recommendation of Stock Advisor Canada.