- Futures slide as weak global factory data prompts fears U.S.-China trade progress may have come too late
- Yields drop on renewed risk off
- Bitcoin's tumbles to near 20% slump
- WTI drops as global demand worries offset positive OPEC+ headlines
Key Events
Futures on the S&P 500, Dow and NASDAQ 100 staggered this morning, giving up yesterday's new record highs after signs of slowing manufacturing activity in the U.S. and across Europe and Asia prompted fears that progress in U.S.-China trade relations may have come too little too late to rescue the global economy from further weakening. Demand for Treasurys climbed on renewed economic worries, while oil prices took a beating from the increased outlook for dwindling demand.
Europe's STOXX 600, however, managed to crawl higher after stumbling upon resistance.
In the earlier Asian session, Hong Kong’s Hang Seng (+1.17%) outperformed despite violent protests overnight, as the city was catching up to yesterday’s trade truce-related rallies after a local holiday. South Korea’s KOSPI (-0.36) lagged for the second day, still reeling from Japan’s plan to restrict exports of materials that are vital to the neighboring country's tech industry.
Global Financial Affairs
On Monday, U.S. equities gapped up to fresh all-time highs on the trade cease-fire reached by the U.S. and China on Saturday, but finished well off those levels as data showing U.S. factory activity grew at the slowest pace since October 2016 suggested the truce may have come too late.
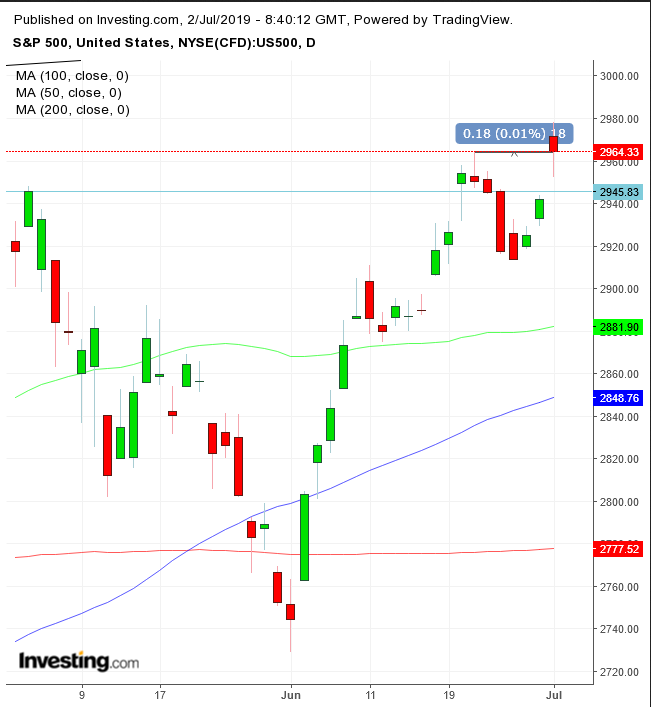
The S&P 500 climbed 0.77%, with all sectors but defensive Utilities and Real Estate—both down 0.20%—hitting a record close—for the first time since June 20—as well as an all-time high—for the first time since June 21. Technology (+1.61%) led the rally as chipmakers benefited from President Donald Trump's vows to ease a ban on U.S. companies supplying Chinese tech giant Huawei.
Shares in the Industrials (+0.17%) and Energy (+0.14%) sectors lagged. Trading in the former was muted, as a drop on new orders overshadowed factory activity that wasn’t as weak as expected; the latter tracked falling oil prices after global economic data reawakened demand concerns, offsetting plans, by OPEC+ producers, to extend supply cuts till March next year.
Technically, while the SPX closed 0.18 points above its June 21 record high, demonstrating resistance.
The Dow Jones Industrial Average gained 0.44%, but it was the NASDAQ Composite that shone brightest (+1.06%), nearing a two-month high.
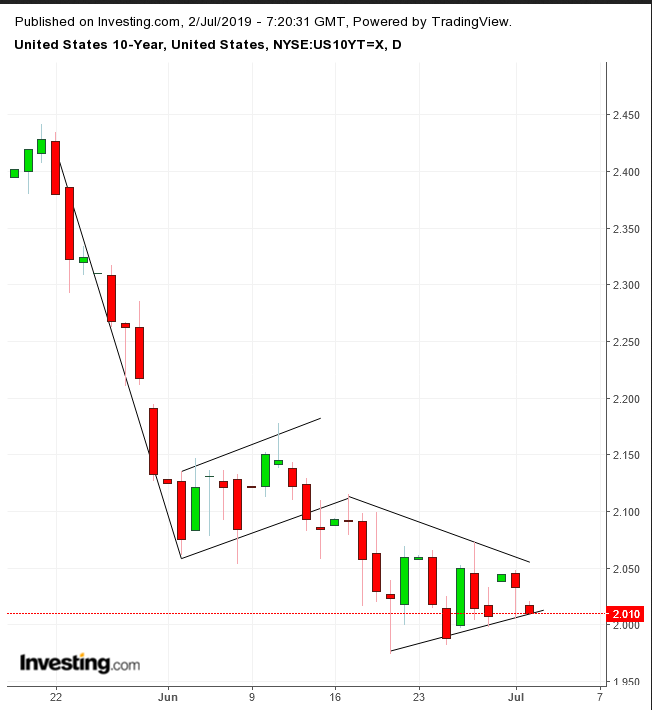
Investors added to Treasury holdings as signs of staggering global trading and manufacturing activity re-ignited risk off. Technically, the yield on 10-year bonds is testing the bottom of a pennant continuation pattern for the fourth time, attempting to break out and resume the downtrend. The bearish pattern began to develop on the heels of a completed rising flag, also bearish, following the previous drop.
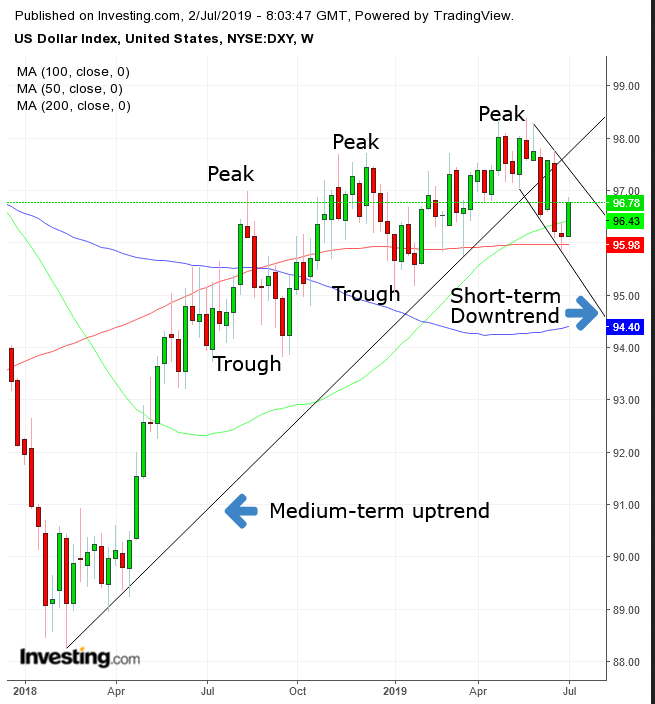
The dollar stalled after yesterday’s 0.74% surge to a near two-week high—its biggest move since March 21. Technically, yesterday’s jump crossed back above the 200 DMA, after bouncing off the 200 WMA last week. The USD nears the top of its falling channel within the short term, while it maintains an uptrend in the medium-term.
The Australian dollar strengthened after the Reserve Bank of Australia cut rates as expected but suggested a further cut may not be warranted.
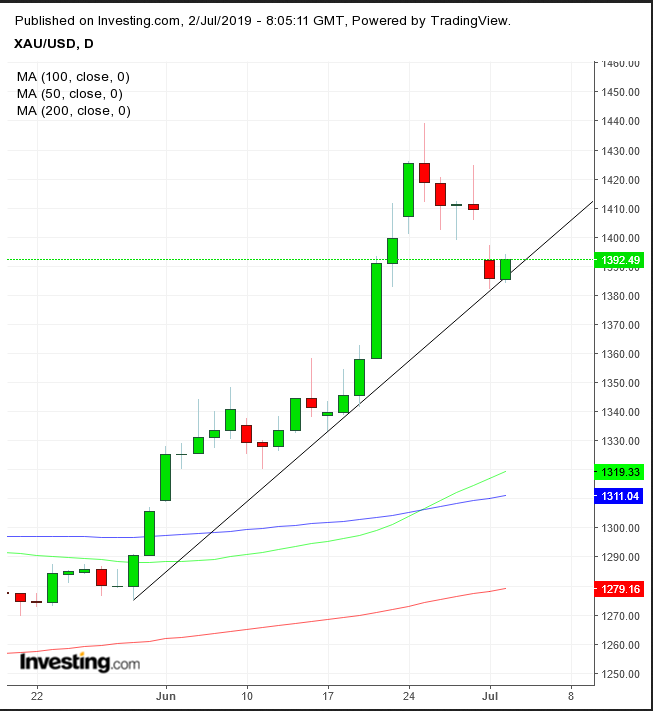
Gold found support by its uptrend line since May 30, after the 50 DMA crossed over the 100 DMA in the 7% surge between June 17 and June 24.
Bitcoin was seen tumbling for a fourth straight day, bringing its recent losses to near 20% and prompting some analysts to label it a bubble burst after an unsustainable rally.
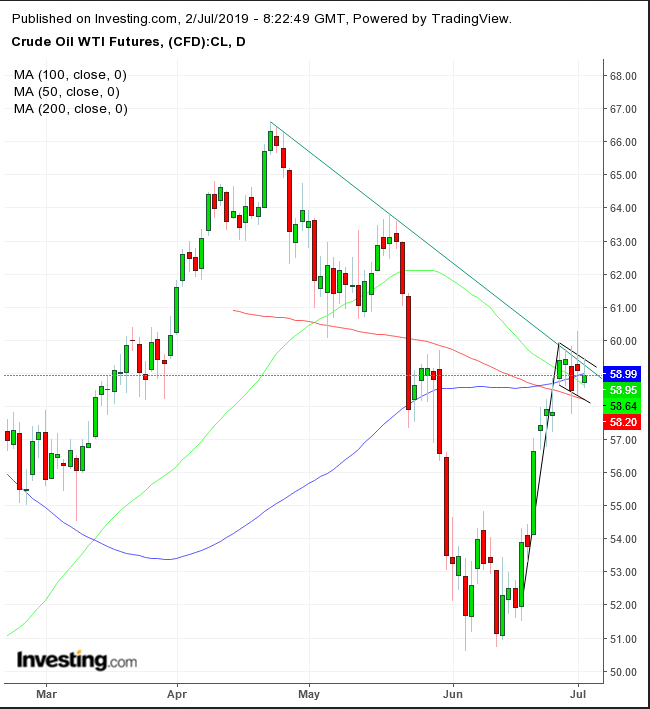
WTI crude slipped lower but still managed to pare a heavier slump that was spurred by reports of slowing global manufacturing activity, which overshadowed upbeat headlines from the OPEC and OPEC+ summit in Vienna.
Technically, however, the price is developing a falling flag, bullish after the recent advance. Its development between the downtrend line since late April and the 200 DMA underlines the importance of this price level and the likelihood of a violent move to follow, probably upwards.
Up Ahead
- Euro-zone producer prices for May are due on Tuesday, followed by PMI data on Wednesday.
- U.S. markets remain closed on Thursday in observance of the Independence Day.
- The U.S. jobs report, due on Friday, is projected to show nonfarm payrolls rose by 160,000 in June, rebounding from 75,000 the previous month.
Market Moves
Stocks
- The U.K.’s FTSE 100 climbed 0.2% to the highest in 10 weeks.
- The MSCI Emerging Market Index gained less than 0.05%, reaching the highest in two months on its fifth consecutive advance.
- The MSCI Asia Pacific Index gained 0.3% to the highest in two months.
Currencies
- The Dollar Index fell less than 0.1%.
- The euro advanced 0.1% to $1.1295, the largest gain in more than a week.
- The British pound slipped 0.1% to $1.2628, the weakest in two weeks.
- The Japanese yen climbed 0.1% to 108.32 per dollar, the largest increase in more than a week.
Bonds
- The yield on 10-year Treasurys dropped one basis point to 2.01%.
- Germany’s 10-year yield was unchanged at -0.36%, near the lowest on record.
- Britain’s 10-year yield fell one basis point to 0.8%, the lowest in a week.
Commodities
- West Texas Intermediate crude increased 0.1% to $59.14 a barrel.
- Gold advanced 0.6% to $1,392.77 an ounce, the biggest gain in more than a week.
