ASM International NV (ASMI)

Amsterdam
Currency in EUR
519.40
-6.00(-1.14%)
Closed·
ASMI Scorecard
Full Analysis
Holds more cash than debt on its balance sheet
ASMI is not included in our AI-picked strategies. See which stocks are.
Fair Value
Day's Range
509.20522.60
52 wk Range
333.30748.00
Key Statistics
Edit
Prev. Close
525.4
Open
510.6
Day's Range
509.2-522.6
52 wk Range
333.3-748
Volume
116.18K
Average Volume (3m)
173.5K
1-Year Change
-24.53%
Book Value / Share
74.56
Fair Value
unlockUnlock
Fair Value Upside
unlockUnlock
ASMI Scorecardpro icon
Company’s Health
Unlock
Fair Value
Unlock Price
Fair Price
Upside
Price Target
608.90
Upside
+17.23%
Members' Sentiments
Bearish
Bullish
ProTips
2 analysts have revised their earnings upwards for the upcoming period

ASM International NV News & Analysis

Show more

ASM International NV Company Profile

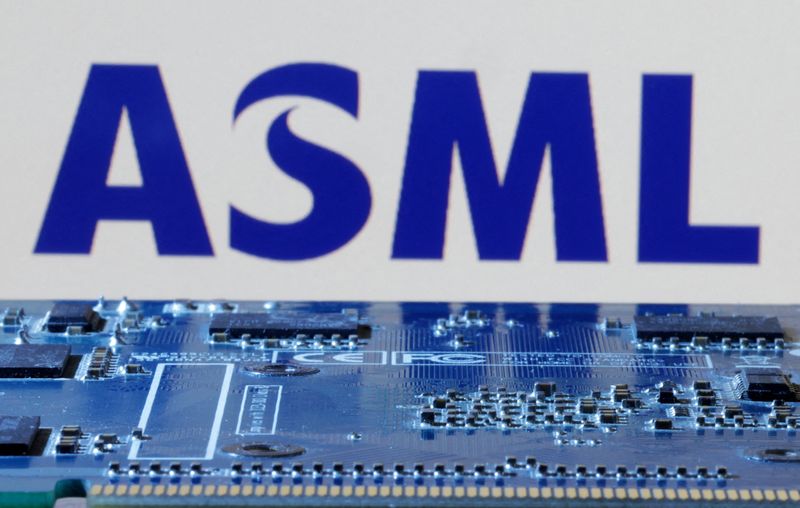
ASM International NV, together with its subsidiaries, engages in the research, development, manufacture, marketing, and servicing of equipment and materials used to produce semiconductor devices in Europe, the United States, and Asia. The company’s products include wafer processing deposition systems for atomic layer deposition (ALD); epitaxy; silicon carbide; plasma enhanced chemical vapor deposition (PECVD); and vertical furnace systems, including low pressure chemical vapor deposition (LPCVD), diffusion, and oxidation products, as well as provides spare parts and support services. It also manufactures and sells equipment, which is used in wafer processing, encompassing the fabrication steps in which silicon wafers are layered with semiconductor devices. The company offers its products to semiconductor manufacturers. The company was formerly known as Advanced Semiconductor Materials International NV. ASM International NV was incorporated in 1968 and is headquartered in Almere, the Netherlands.

Compare ASMI to Peers and Sector

Metrics to compare
ASMI
Peers
Sector
Relationship
P/E Ratio
52.6x23.9x11.6x
PEG Ratio
−4.880.240.01
Price/Book
7.0x3.2x2.4x
Price / LTM Sales
8.1x3.7x2.1x
Upside (Analyst Target)
15.7%20.0%22.9%
Fair Value Upside
Unlock4.9%7.0%Unlock

Analyst Ratings

17 Buy
3 Hold
0 Sell
Ratings:
20 analysts
Overall Consensus
Buy

Analysts 12-Month Price Target:

Average 608.90
(+17.23% Upside)

Dividends

Payout Ratio
Payout ratio (TTM)
Earnings retained
EPS 9.85%
Dividend Yield
0.57%
Industry Median 0.91%
Annualized payout
3.00
Paid annually
5-Years Growth
+14.87%
Growth Streak

Earnings

Latest Release
Apr 29, 2025
EPS / Forecast
3.91 / 3.98
Revenue / Forecast
839.20M / 834.29M
EPS Revisions
Last 90 days

ASMI Income Statement

People Also Watch

125.90
BESI
+2.57%
35.85
AD
-0.03%
94.20
HAGG
-0.11%
22.76
ABNd
-0.48%
142.00
ENX
-0.56%

FAQ

What Is the ASM (ASMI) Stock Price Today?

The ASM stock price today is 519.40

What Stock Exchange Does ASM Trade On?

ASM is listed and trades on the Amsterdam Stock Exchange stock exchange.

What Is the Stock Symbol for ASM?

The stock symbol for ASM is "ASMI."

Does ASM Pay Dividends? What’s The Current Dividend Yield?

The ASM dividend yield is 0.57%.

What Is the ASM Market Cap?

As of today, ASM market cap is 25.57B.

What Is ASM's Earnings Per Share (TTM)?

The ASM EPS (TTM) is 9.85.

When Is the Next ASM Earnings Date?

ASM will release its next earnings report on Jul 22, 2025.

From a Technical Analysis Perspective, Is ASMI a Buy or Sell?

Based on moving averages and other technical indicators, the daily buy/sell signal is Strong Buy.

How Many Times Has ASM Stock Split?

ASM has split 0 times.

How Many Employees Does ASM Have?

ASM has 4558 employees.

What is the current trading status of ASM (ASMI)?

As of Jun 13, 2025, ASM (ASMI) is trading at a price of 519.40, with a previous close of 525.40. The stock has fluctuated within a day range of 509.20 to 522.60, while its 52-week range spans from 333.30 to 748.00.
Risk Disclosure: Trading in financial instruments and/or cryptocurrencies involves high risks including the risk of losing some, or all, of your investment amount, and may not be suitable for all investors. Prices of cryptocurrencies are extremely volatile and may be affected by external factors such as financial, regulatory or political events. Trading on margin increases the financial risks.
Before deciding to trade in financial instrument or cryptocurrencies you should be fully informed of the risks and costs associated with trading the financial markets, carefully consider your investment objectives, level of experience, and risk appetite, and seek professional advice where needed.
Fusion Media would like to remind you that the data contained in this website is not necessarily real-time nor accurate. The data and prices on the website are not necessarily provided by any market or exchange, but may be provided by market makers, and so prices may not be accurate and may differ from the actual price at any given market, meaning prices are indicative and not appropriate for trading purposes. Fusion Media and any provider of the data contained in this website will not accept liability for any loss or damage as a result of your trading, or your reliance on the information contained within this website.
It is prohibited to use, store, reproduce, display, modify, transmit or distribute the data contained in this website without the explicit prior written permission of Fusion Media and/or the data provider. All intellectual property rights are reserved by the providers and/or the exchange providing the data contained in this website.
Fusion Media may be compensated by the advertisers that appear on the website, based on your interaction with the advertisements or advertisers.
© 2007-2025 - Fusion Media Limited. All Rights Reserved.