Rtx Corp (RTX)

Currency in USD
185.76
+0.08(+0.04%)
Closed·
185.76+0.02(+0.01%)
·
Trading near 52-week High
RTX is not included in our AI-picked strategies. See which stocks are.
Fair Value
Day's Range
185.26188.00
52 wk Range
112.27188.00
Key Statistics
Prev. Close
185.76
Open
185.75
Day's Range
185.26-188
52 wk Range
112.27-188
Volume
3.35M
Average Volume (3m)
4.8M
1-Year Change
59.26%
Book Value / Share
48.14
Fair Value
unlockUnlock
Fair Value Upside
unlockUnlock
RTX Scorecardpro icon
Company’s Health
Unlock
Fair Value
Unlock Price
Fair Price
Upside
Price Target
195.95
Upside
+5.49%
Members' Sentiments
Bearish
Bullish
ProTips
Trading at a low P/E ratio relative to near-term earnings growth

Rtx Corp News & Analysis

Show more

Technical Analysis

Summary
Strong Sell
Sell
Neutral
Buy
Strong Buy
Strong Buy
Technical Indicators
Strong Buy
Moving Averages
Buy

Rtx Corp Company Profile

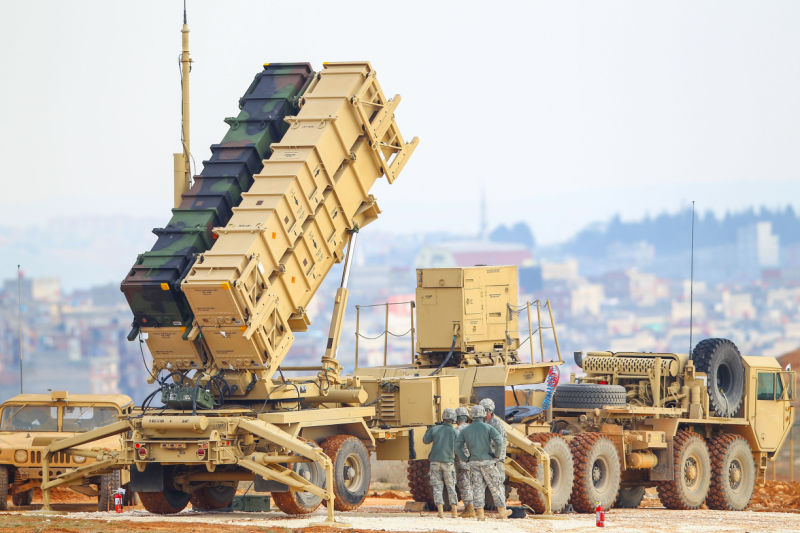
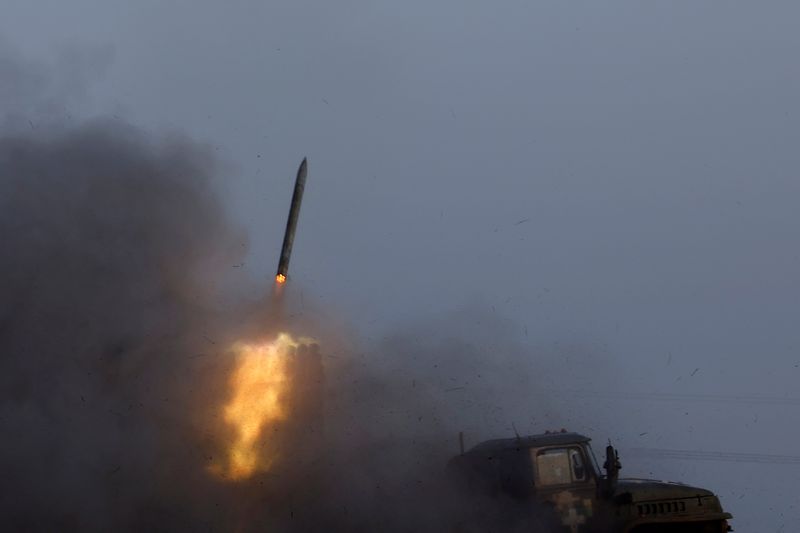
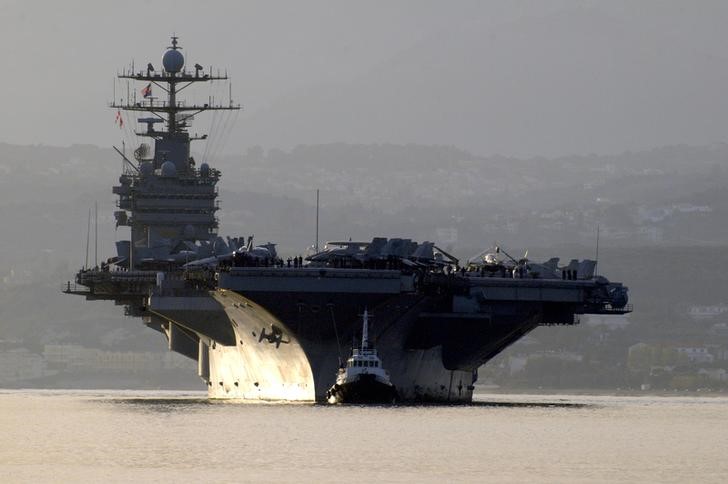
RTX Corporation, an aerospace and defense company, provides systems and services for the commercial, military, and government customers in the United States and internationally. It operates through three segments: Collins Aerospace, Pratt & Whitney, and Raytheon. The Collins Aerospace Systems segment offers aerospace and defense products, and aftermarket service solutions for civil and military aircraft manufacturers and commercial airlines, as well as regional, business, and general aviation, defense, and commercial space operations. This segment also designs, produces, and supports cabin interior, including seating, oxygen systems, food and beverage preparation, storage and galley systems, and lavatory and wastewater management systems; battlespace, test and training range systems, crew escape systems, and simulation and training solutions; information management services; and aftermarket services that include spare parts, overhaul and repair, engineering and technical support, training and fleet management solutions, and asset and information management services. The Pratt & Whitney segment supplies aircraft engines for commercial, military, business jet, and general aviation customers; and produces, sells, and services military and commercial auxiliary power units. The Raytheon segment provides defensive and offensive threat detection, tracking, and mitigation capabilities for government, and commercial customers. The company was formerly known as Raytheon Technologies Corporation and changed its name to RTX Corporation in July 2023. RTX Corporation was incorporated in 1934 and is headquartered in Arlington, Virginia.

Employees
186000

Rtx Corp Earnings Call Summary for Q3/2025

  • RTX beats Q3 2025 forecasts: EPS $1.70 vs $1.41 expected, revenue $22.5B vs $21.27B expected
  • Stock surges 8.71% to $172 pre-market; full-year guidance raised for sales and EPS
  • Adjusted sales up 12%, organic growth 13%; backlog reaches $251B, up 13% year-over-year
  • CEO highlights strong demand, capacity investments, and goal of 90-100% free cash flow conversion
  • Risks include supply chain constraints, economic uncertainties, and geopolitical tensions
Last Updated: 2025-10-21, 09:50 a/m
Read Full Transcript

Compare RTX to Peers and Sector

Metrics to compare
RTX
Peers
Sector
Relationship
P/E Ratio
37.8x27.4x12.3x
PEG Ratio
0.980.670.03
Price/Book
3.9x3.0x1.4x
Price / LTM Sales
2.9x1.4x1.2x
Upside (Analyst Target)
7.7%15.2%19.7%
Fair Value Upside
Unlock−0.6%6.1%Unlock

Analyst Ratings

14 Buy
7 Hold
0 Sell
Ratings:
21 analysts
Overall Consensus
Buy

Analysts 12-Month Price Target:

Average 195.95
(+5.49% Upside)
Firm
ArticlePositionPrice TargetUpside / DownsideFrom Price TargetActionDate
JPMorgan
Buy200.00+7.67%195.00MaintainDec 19, 2025
Citi
Buy211.00+13.59%-New CoverageDec 12, 2025
Jefferies
Hold190.00+2.28%175.00MaintainNov 25, 2025
BNP Paribas Exane
Buy210.00+13.05%-New CoverageNov 18, 2025
UBS
Buy202.00+8.74%197.00MaintainOct 22, 2025

Dividends

Payout Ratio
Payout ratio (TTM)
Earnings retained
EPS 4.87%
Dividend Yield
1.46%
Industry Median 0.94%
Annualized payout
2.72
Paid quarterly
5-Years Growth
+1.64%
Growth Streak

Earnings

Latest Release
Oct 21, 2025
EPS / Forecast
1.70 / 1.41
Revenue / Forecast
22.50B / 21.27B
EPS Revisions
Last 90 days

RTX Income Statement

People Also Watch

1,071.64
LLY
-0.45%
87.68
MRVL
+3.40%
188.12
PANW
-0.72%
42.070
IREN
+0.07%
81.88
OKLO
-1.87%

FAQ

What Is the Rtx Corp (RTX) Stock Price Today?

The Rtx Corp stock price today is 185.76

What Stock Exchange Does Rtx Corp Trade On?

Rtx Corp is listed and trades on the New York Stock Exchange stock exchange.

What Is the Stock Symbol for Rtx Corp?

The stock symbol for Rtx Corp is "RTX."

Does Rtx Corp Pay Dividends? What’s The Current Dividend Yield?

The Rtx Corp dividend yield is 1.46%.

What Is the Rtx Corp Market Cap?

As of today, Rtx Corp market cap is 249.06B.

What Is Rtx Corp's Earnings Per Share (TTM)?

The Rtx Corp EPS (TTM) is 4.87.

When Is the Next Rtx Corp Earnings Date?

Rtx Corp will release its next earnings report on Jan 27, 2026.

From a Technical Analysis Perspective, Is RTX a Buy or Sell?

Based on moving averages and other technical indicators, the daily buy/sell signal is Strong Buy.

How Many Times Has Rtx Corp Stock Split?

Rtx Corp has split 0 times.

How Many Employees Does Rtx Corp Have?

Rtx Corp has 186000 employees.

What is the current trading status of Rtx Corp (RTX)?

As of Dec 24, 2025, Rtx Corp (RTX) is trading at a price of 185.76, with a previous close of 185.76. The stock has fluctuated within a day range of 185.26 to 188.00, while its 52-week range spans from 112.27 to 188.00.

What Is Rtx Corp (RTX) Price Target According to Analysts?

The average 12-month price target for Rtx Corp is USD195.95, with a high estimate of USD219 and a low estimate of USD150. 14 analysts recommend buying the stock, while 0 suggest selling, leading to an overall rating of Buy. The stock has an +5.49% Upside potential.

What Is the RTX After Hours Price?

RTX's last after hours stock price is 185.76, the stock has decreased by 0.02, or 0.01%.
Risk Disclosure: Trading in financial instruments and/or cryptocurrencies involves high risks including the risk of losing some, or all, of your investment amount, and may not be suitable for all investors. Prices of cryptocurrencies are extremely volatile and may be affected by external factors such as financial, regulatory or political events. Trading on margin increases the financial risks.
Before deciding to trade in financial instrument or cryptocurrencies you should be fully informed of the risks and costs associated with trading the financial markets, carefully consider your investment objectives, level of experience, and risk appetite, and seek professional advice where needed.
Fusion Media would like to remind you that the data contained in this website is not necessarily real-time nor accurate. The data and prices on the website are not necessarily provided by any market or exchange, but may be provided by market makers, and so prices may not be accurate and may differ from the actual price at any given market, meaning prices are indicative and not appropriate for trading purposes. Fusion Media and any provider of the data contained in this website will not accept liability for any loss or damage as a result of your trading, or your reliance on the information contained within this website.
It is prohibited to use, store, reproduce, display, modify, transmit or distribute the data contained in this website without the explicit prior written permission of Fusion Media and/or the data provider. All intellectual property rights are reserved by the providers and/or the exchange providing the data contained in this website.
Fusion Media may be compensated by the advertisers that appear on the website, based on your interaction with the advertisements or advertisers.
© 2007-2025 - Fusion Media Limited. All Rights Reserved.