SFI PJSC (SFIN)

Currency in RUB
698.20
+9.20(+1.34%)
Real-time Data·
SFIN is not included in our AI-picked strategies. See which stocks are.
Fair Value
Day's Range
686.80705.80
52 wk Range
656.401,948.80
Key Statistics
Prev. Close
689
Open
689
Day's Range
686.8-705.8
52 wk Range
656.4-1,948.8
Volume
61.18K
Average Volume (3m)
292.12K
1-Year Change
-44.3416%
Book Value / Share
1,296.72
Fair Value
unlockUnlock
Fair Value Upside
unlockUnlock
SFIN Scorecardpro icon
Company’s Health
Unlock
Fair Value
Unlock Price
Fair Price
Upside
Analysts Sentiment
Currently not supported.
Members' Sentiments
Bearish
Bullish
ProTips
RSI suggests the stock is in oversold territory

SFI PJSC News & Analysis

Show more

Technical Analysis

Summary
Strong Sell
Sell
Neutral
Buy
Strong Buy
Strong Buy
Technical Indicators
Strong Buy
Moving Averages
Buy
Firm
ArticlePositionPrice TargetUpside / DownsideFrom Price TargetActionDate

Earnings

Latest Release
Mar 26, 2026
EPS / Forecast
-8.06 / --
Revenue / Forecast
326.54M / --
EPS Revisions
Last 90 days

SFIN Income Statement

Compare SFIN to Peers and Sector

Metrics to compare
SFIN
Peers
Sector
Relationship
P/E Ratio
11.4x11.7x9.8x
PEG Ratio
4.490.090.03
Price/Book
0.5x1.7x1.0x
Price / LTM Sales
6.9x1.7x2.8x
Upside (Analyst Target)
-20.6%17.7%
Fair Value Upside
Unlock12.8%2.7%Unlock

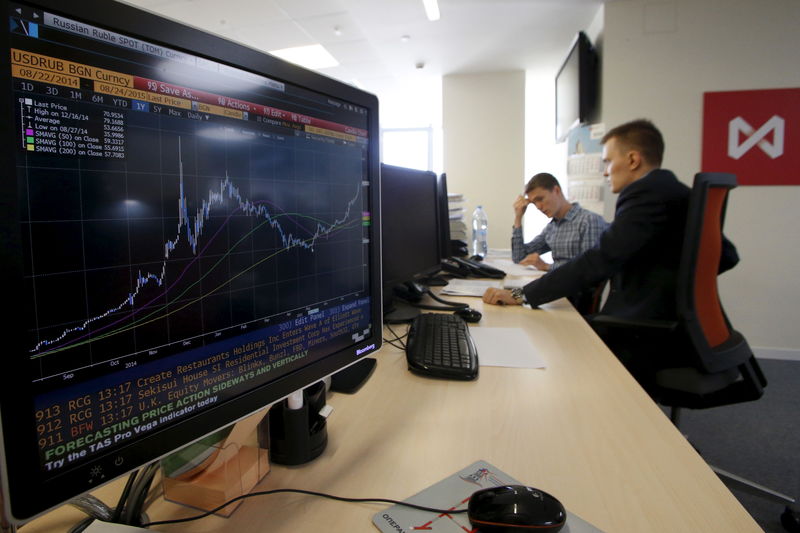
Public Joint Stock Company "SFI", an investment holding company, owns and manages assets across various sectors in Russia. It also sells insurance products, as well as engages in investment business. In addition, it is involved in leasing financing for individual entrepreneurs and legal entities, as well as acquires leased assets. The company was formerly known as Public Joint Stock Company “SAFMAR Financial investments”. Public Joint Stock Company "SFI" was incorporated in 2016 and is headquartered in Moscow, Russia. Public Joint Stock Company "SFI" is a subsidiary of MKOOO "Lanbury".

Sector
Financial
Employees
2924
Market
Russia

Ownership

Ownership Overview

Type
Common Stock Held% of Shares OutstandingMarket Value
Mutual Funds & ETFs
257.91K0.53%158.25M
Other Institutional Investors
5.44K0.01%3.34M
Public Companies & Retail Investors
48.36M99.46%29.67B
Total
48.62M100.00%29.84B

Top Holders

Holder
% of holding
Shares Held
Date Reported
Value (In 1,000s)
Grantham Mayo Van Otterloo & Co. LLC0.25%123,33375,677
AXA Investment Managers S.A.0.10%50,58031,036

People Also Watch

60.85
EUTR
-1.14%
50.37
RTKM
-0.57%
409.80
SMLT
+0.29%
1,862.00
LENT
+0.27%
195.90
SPBE
-1.95%

FAQ

What Is the SFI (SFIN) Stock Price Today?

The SFI stock price today is 698.20 RUB.

What Stock Exchange Does SFI Trade On?

SFI is listed and trades on the Moscow Stock Exchange.

What Is the Stock Symbol for SFI?

The stock symbol for SFI is "SFIN."

What Is the SFI Market Cap?

As of today, SFI market cap is 34.35B RUB.

What Is SFI's Earnings Per Share (TTM)?

The SFI EPS (TTM) is 56.16.

From a Technical Analysis Perspective, Is SFIN a Buy or Sell?

Based on moving averages and other technical indicators, the daily buy/sell signal is Neutral.

How Many Times Has SFI Stock Split?

SFI has split 1 times.

How Many Employees Does SFI Have?

SFI has 2924 employees.

What is the current trading status of SFI (SFIN)?

As of Jun 16, 2026, SFI (SFIN) is trading at a price of 698.20 RUB, with a previous close of 689.00 RUB. The stock has fluctuated within a day range of 686.80 RUB to 705.80 RUB, while its 52-week range spans from 656.40 RUB to 1,948.80 RUB.
Risk Disclosure: Trading in financial instruments and/or cryptocurrencies involves high risks including the risk of losing some, or all, of your investment amount, and may not be suitable for all investors. Prices of cryptocurrencies are extremely volatile and may be affected by external factors such as financial, regulatory or political events. Trading on margin increases the financial risks.
Before deciding to trade in financial instrument or cryptocurrencies you should be fully informed of the risks and costs associated with trading the financial markets, carefully consider your investment objectives, level of experience, and risk appetite, and seek professional advice where needed.
Fusion Media would like to remind you that the data contained in this website is not necessarily real-time nor accurate. The data and prices on the website are not necessarily provided by any market or exchange, but may be provided by market makers, and so prices may not be accurate and may differ from the actual price at any given market, meaning prices are indicative and not appropriate for trading purposes. Fusion Media and any provider of the data contained in this website will not accept liability for any loss or damage as a result of your trading, or your reliance on the information contained within this website.
It is prohibited to use, store, reproduce, display, modify, transmit or distribute the data contained in this website without the explicit prior written permission of Fusion Media and/or the data provider. All intellectual property rights are reserved by the providers and/or the exchange providing the data contained in this website.
Fusion Media may be compensated by the advertisers that appear on the website, based on your interaction with the advertisements or advertisers.
© 2007-2026 - Fusion Media Limited. All Rights Reserved.