
Roots Corp. (TSX:ROOT) is currently trading only at roughly half of its initial public offering price from October 2017. At $6.13 per share as of writing, the stock trades at a blended price-to-earnings multiple of about nine.
Is the apparel retailer a strong buy or a value trap? Let’s explore the answer to that question.
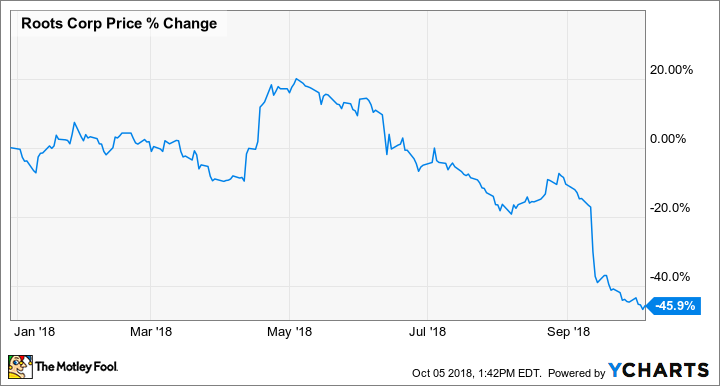
ROOT data by YCharts. Roots’ year-to-date returns.
The business
Roots was established 45 years ago in 1973. It began with its first store in Toronto. It’s an iconic Canadian brand with a portfolio of premium apparel, leather goods, accessories, and footwear.
Roots sells globally with a flexible sourcing network and a proven distribution footprint. It has a Canadian leather manufacturing facility, which has a focus on quality. It delivers products to its customers through its store network, online platform, and international partnerships.
Its integrated omni-channel footprint consists of 122 stores in North America, including the majority of stores in Canada and a few stores in the U.S., 112 partner-operated stores in Taiwan, and 27 partner-operated stores in China. It also has a global e-commerce platform that ships to about 54 countries.
Recent results that pressured the stock
In the first half of the fiscal year that ended on August 4, Roots’ sales increased by almost 4.6% to about $111.2 million compared to the first half of fiscal 2017. It reported a net loss of about $9.7 million, which was worse than the net loss of roughly $8.3 million experienced in the previous year. This translated to diluted loss per share of $0.23 compared to 2017’s loss of $0.21.
Roots’ operating cash flow was also in negative territory — -$24 million compared to 2017’s -$16.5 million in the same period.
Although its store traffic is expected to continue to be weak heading into fiscal Q3, the company expects continued growth for its e-commerce sales as well as its partner stores in Asia.
What about the balance sheet?
At the end of fiscal Q2, Roots had total current assets of $67.6 million. The biggest item was its inventories at almost $50.3 million. Roots tends to keep its inventories less than $40 million. So, it would be more reassuring if its inventories lowered to that level in the coming quarters.
After all, retailers need some inventory but don’t necessarily want it to pile up. In comparison, Roots had total current liabilities of about $40 million.
Roots had total assets of $373 million compared to total liabilities of $179.6 million at the end of fiscal Q2. So, it had a debt ratio (calculated by total debt divided by total assets) of about 0.48.
Investor takeaway
At the end of fiscal Q2, management maintained its fiscal 2019 targets, including sales of $410-450 million, adjusted earnings before interest, taxes, depreciation, and amortization of $61-68 million, and adjusted net income of $35-40 million.
Some analysts believe Roots’ share price can double from current levels. So, Roots is a potentially lucrative turnaround investment for the next one to two years. Cautious investors might observe the stock for another quarter or two before deciding whether or not to buy.
Fool contributor Kay Ng has no position in any of the stocks mentioned.