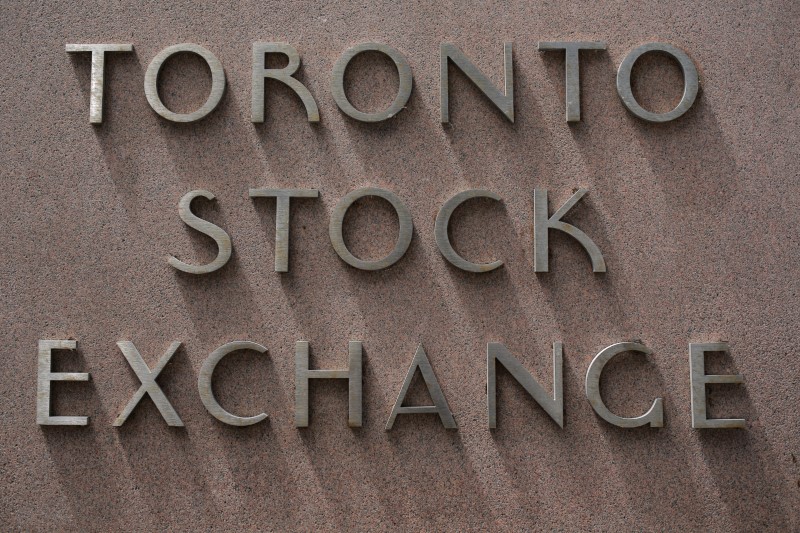
Baystreet.ca - Canada's main stock index reached depths it hadn’t seen for a long time on Tuesday with mining and health-care stocks leading broader declines as investors caught up to Monday's global stocks rout after a Canadian market holiday.
The TSX Composite Index sank 248.27 points, or 1.1%, to conclude a dismal Tuesday at 21,979.36.
The Canadian dollar gained 0.14 cents at 72.58 cents U.S.
Suncor Energy (TSX:SU) is expected to report its quarterly earnings after the closing bell. The oil giant grabbed 15 cents to $51.08.
Mining stocks led the way down, as Algoma Steel (TSX:ASTL) faltered 93 cents, or 7.1%, to $12.16, while SSR Mining (NASDAQ:SSRM) slipped 45 cents, or 6.8%, to $6.20.
In gold plays, Aya Gold dipped 88 cents, or 6.2%, to $13.39, while Sandstorm Gold (TSX:SSL) was negative 49 cents, or 6.4%, to $7.12.
Health-care stocks ailed, as Tilray (TSX:TLRY) closed 10 cents lower, or 3.9%, to $2.48, while Bausch Health (TSX:BHC) Companies fell 25 cents, or 3.2%, to $7.54.
Communications tried to balance things out, as Quebecor (TSX:QBRa) picked up 86 cents, or 2.8%, to $31.86, while BCE (TSX:BCE) advanced 57 cents, or 1.2%, to $48.17.
In real-estate, Granite REIT (TSX:GRT_u) hiked $1.44, or 2%, to $74.78, while First Capital REIT took on 23 cents, or 1.4%, to $16.82.
Markets in Canada were closed Monday for Civic Day.
ON BAYSTREET
The TSX Venture Exchange tumbled 12.89 points, or 2.3%, to 542.67.
All but two of the 12 TSX subgroups were lower, weighed most by materials and gold, each fading 2.5%, while health-care forfeited 1.7%.
The lone gainers proved to be in communications, up 0.5%, and real-estate, inching ahead 0.3%.
ON WALLSTREET
Stocks jumped Tuesday, recovering some losses from the previous three trading days as investors took a pause from recession fears and Japanese equities rallied.
The Dow Jones Industrial index recovered 294.39 points to 38,997.66.
The S&P 500 index gained 53.7 points, or 1%, to 5,240.03.
The NASDAQ surged 166.77 points, or 1%, to close at 16,366.85. All three indexes snapped a three-day stretch of losses.
All 11 sectors of the broad market index were positive for the day. Several mega-cap tech stocks also rebounded after a sharp pullback on Monday. Nvidia (NASDAQ:NVDA) rose 3.8%, while Meta (NASDAQ:META) Platforms advanced 3.9%.
Helping sentiment was a rebound in Japanese stocks. The Nikkei 225 posted its best day since October 2008, soaring 10.2%. That surge comes a day after the benchmark suffered its worst day since 1987, losing 12.4%.
The moves follow a sharp selloff during Monday trading amid concerns over the state of the economy. The 30-stock Dow dropped 1,033.99 points, or 2.6%, while the S&P 500 slid 3%. Both indexes notched their worst sessions since September 2022. The NASDAQ Composite shed 3.4%, tumbling deeper into a correction.
Prices for the 10-year Treasury sank, with yields growing to 3.89% from Monday’s 3.84%. Treasury prices and yields move in opposite directions.
Oil prices eked ahead 10 cents at $73.04 U.S. a barrel.
Gold prices faded $15.30 to $2,429.10.
