- US coronavirus aid package remains in Congressional gridlock
- Chinese and US trade representatives meet this weekend regarding Phase 1
- SPX closed 0.2% from record
Key Events
Contracts for the four major US indices—the S&P 500, Dow Jones, NASDAQ and Russell 2000—wavered on Thursday and European stocks headed lower as a resolution to the US coronavirus relief package standoff remains mired in politics and markets await today's US jobless data.
The dollar extended a decline and oil advanced.
Global Financial Affairs
US futures edged lower the morning after the S&P 500 finished a mere 0.2% from its highest point on record yesterday.
The Stoxx Europe 600 Index opened lower, pulled down by bank shares and mining stocks. Dutch insurer Aegon (AS:AEGN) plummeted 12% after it missed revenue estimates. Earnings were down 31% for the first half of 2020 prompting the company to cut its dividend by 67%.
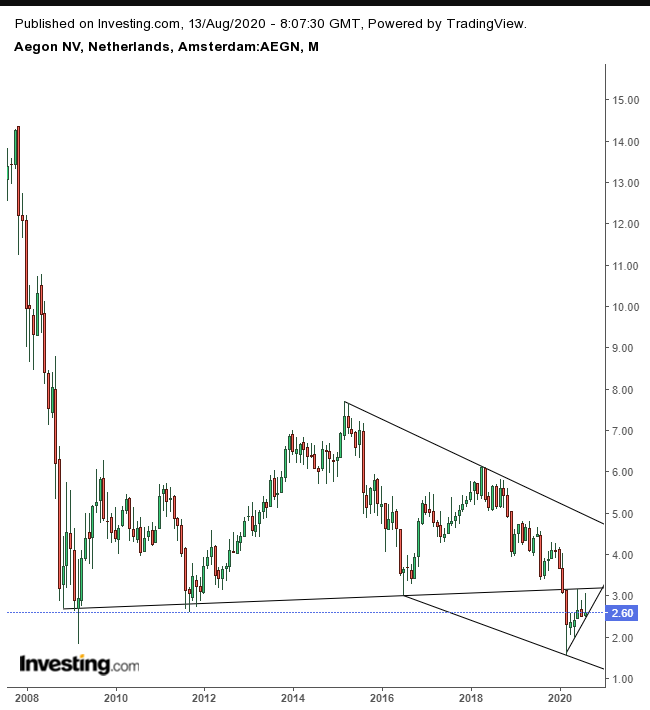
Technically, Aegon found resistance at the 200 DMA, keeping it from pushing higher, forming a H&S continuation pattern, complete with a downside breakout below 2.50. The monthly chart shows the stock completed a massive H&S continuation pattern, going back to the 2008 crash—suggesting the company’s troubles are structural and significantly predate the coronavirus pandemic.
During the Asian session, most indices were higher, with the noted exception of Australia’s ASX 200, (-0.7%). The regional benchmark was pressured by telecommunications company Telstra (ASX:TLS), financial services firm AMP (ASX:AMP) (OTC:AMLTF) and utility provider AGL Energy (ASX:AGL) which all reported shrinking profits—exacerbating concerns of economic hardship due to COVID-19.
Chinese stocks, both on the mainland Shanghai Composite as well as in Hong Kong’s Hang Seng were flat. Japan’s Nikkei outperformed, (+1.8%), soaring to a six month peak as regional investors kept the faith that the Sino-US trade deal will remain intact after a key meeting between the two economic powerhouses this coming weekend.
Wednesday, during the New York session, US stocks advanced, fueled by ongoing, muscular demand for technology stocks. The NASDAQ surged 2.1%, outperforming the other major indices. Apple (NASDAQ:AAPL), Microsoft (NASDAQ:MSFT) and Tesla (NASDAQ:TSLA) each provided a significant boost. And while all 11 sectors of the S&P 500 rose, the gains were mainly due to the Technology sector (+2.25%).
Our opinion on this equity rally amid the pandemic remains: it's nothing short of incredible...and that's not meant in a complimentary way. Investors are placing their faith in a Fed that continues to promise “infinite QE,” even if it’s economically untenable and traders continue to think that President Donald Trump will simply not let the stock market crash ahead of his reelection bid.
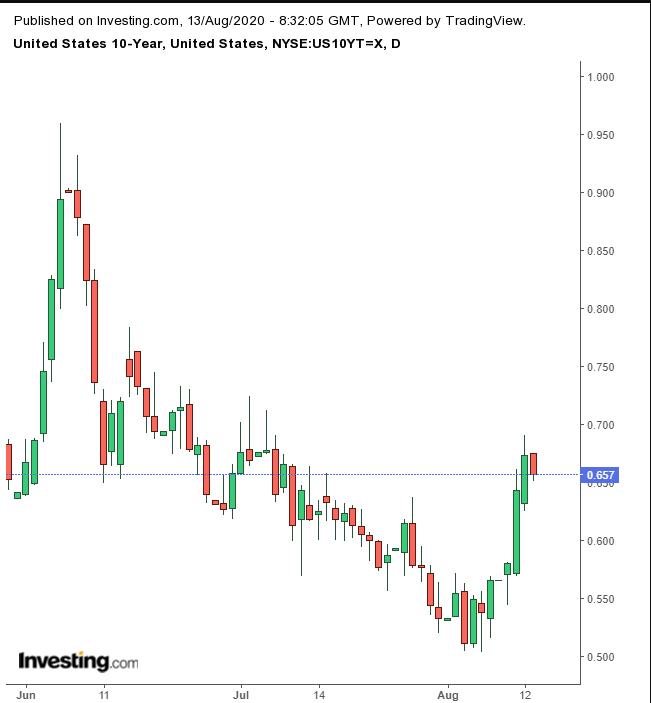
Investors have returned to Treasuries, including the 10-year benchmark note, after yields jumped the most since early June.
Yields weighed on the dollar, sending it lower for a second day, ahead of today's US initial and continuing jobless claims releases.
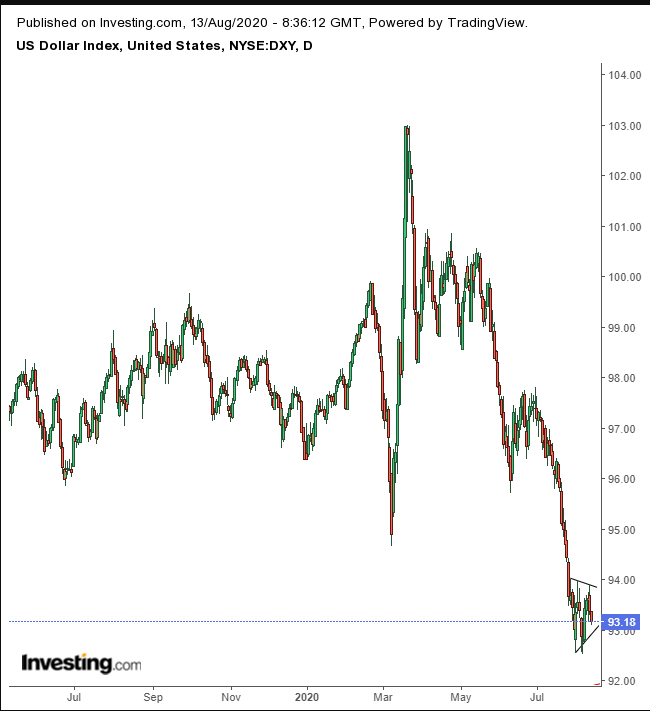
The Dollar Index appears to be developing a continuation pennant, at the bottom of a massive, rising channel, in place since 2009. The bottom of the channel can be seen peeking up, in red, at 92.00.
Gold gave up a second day advance.
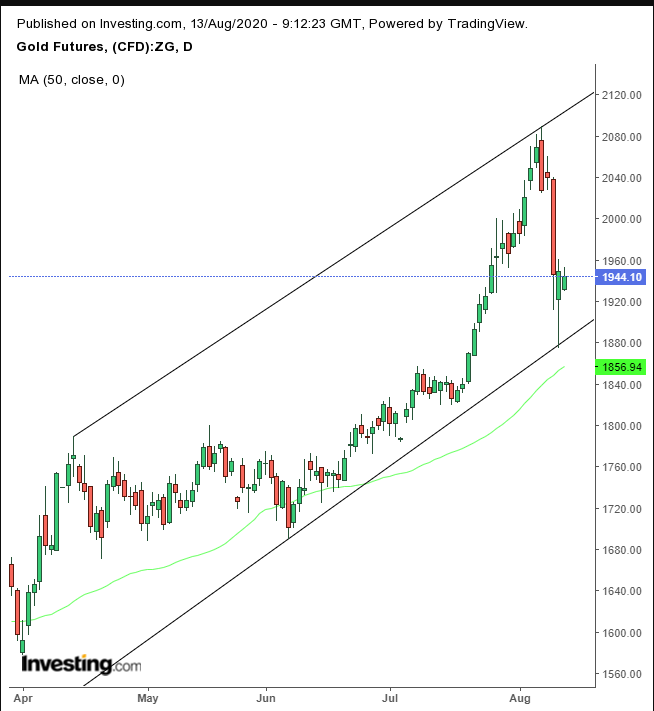
Given that both the dollar and US futures are down, and the VIX is rising, this latest price decline could be nothing more than profit-taking.
Oil rose for a second day on signs of improving demand, as crude stockpiles fell for the third week in a row.
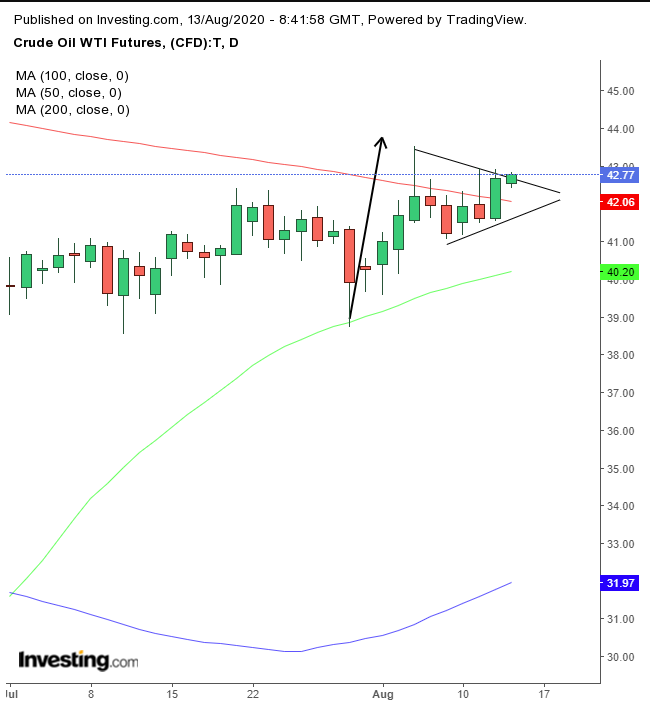
The price of WTI is now the highest it's been since March. It extended the rise above the 200 DMA for the first time since January, for the second day. It may be breaking out of a continuation pennant. Still, it's not clear how much of an oil price recovery we can actually expect during the remainder of 2020.
Up Ahead
- China releases a slew of data for July on Friday, including industrial production and retail sales.
- US retail sales figures will also be released on Friday.
Market Moves
Stocks
- Futures on the S&P 500 Index were little changed.
- The Stoxx Europe 600 Index declined 0.3%.
- Germany’s DAX dipped 0.1%.
- The MSCI Asia Pacific Index advanced 0.6%.
Currencies
- The Dollar Index decreased 0.2 % to 93.17; it's down 0.45% in the last two days.
- The euro advanced 0.3% to $1.182.
- The Japanese yen strengthened 0.2% to 106.74 per dollar.
- The British pound advanced 0.2% to $1.3059.
Bonds
- The yield on 10-year Treasuries decreased two basis points to 0.66%.
- Germany’s 10-year yield decreased one basis point to -0.46%.
- Britain’s 10-year yield fell two basis points to 0.216%.
Commodities
- West Texas Intermediate crude decreased 0.3% to $42.55 a barrel.
- Gold strengthened 0.7% to $1,928.64 an ounce.
- Silver gained 1.1% to trade at $26.27.
