- As we enter a historically weak period for the stock market, negative investor sentiment has moved above its historical average
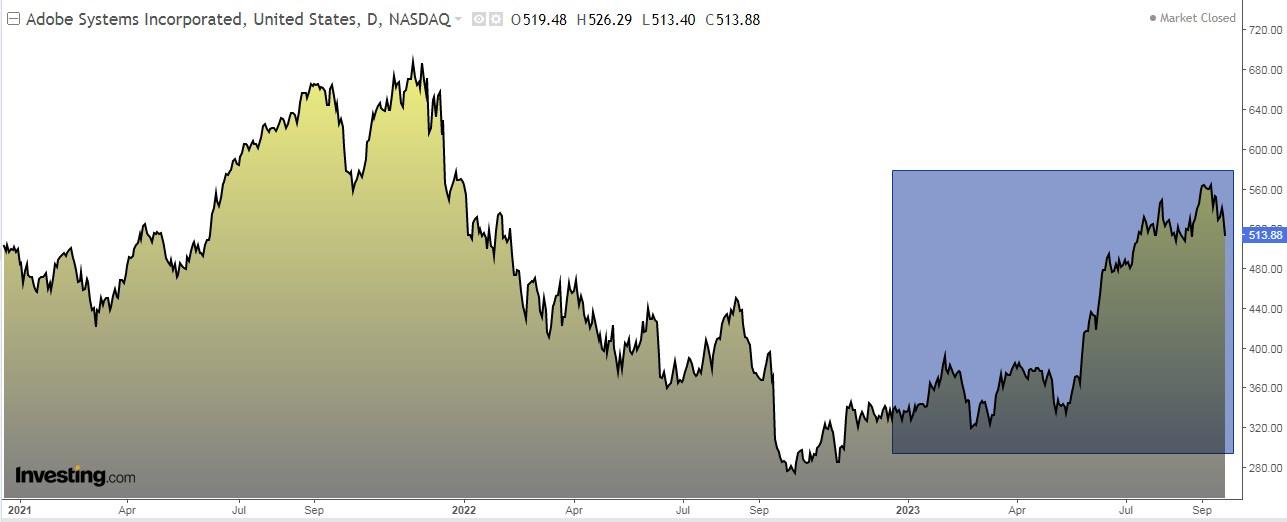
- Meanwhile, recent developments at Adobe have made the stock an appealing buy
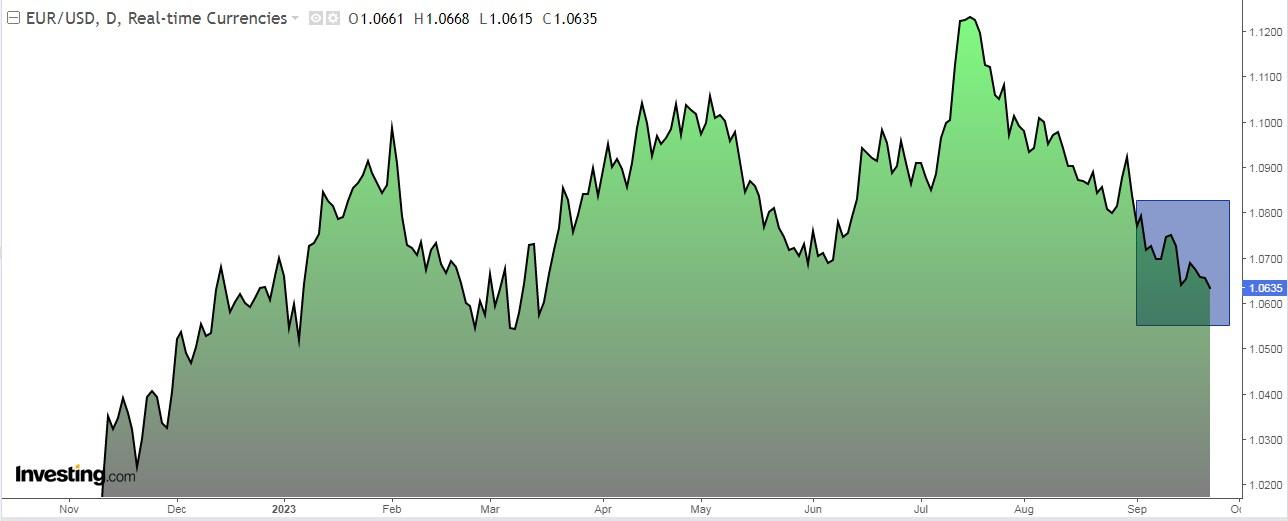
- And, the latest comments from ECB have sent the euro tumbling
The stock market consistently exhibits certain historical patterns year after year, and it is currently entering a phase that has historically been marked by heightened risk.
Although the underlying reasons for these patterns can differ, one recurring trend that deserves investors' attention is in the month of September.
Examining the S&P 500's performance since 1950, the period from the 20th to the 30th of September, on average, has predominantly favored the bears.
- On the 20th: The index dipped by -0.20%.
- On the 21st: It experienced a -0.31% drop.
- On the 22nd: A slight downturn of -0.08% was observed.
- On the 23rd: Another drop of -0.19% occurred.
- On the 24th: The index slipped by -0.12%.
- On the 25th: It continued with a -0.12% decrease.
- On the 26th: A more significant decline of -0.21% was recorded.
- On the 27th: There was a modest uptick of +0.02%.
- On the 28th: The index showed a slight gain of +0.26%.
- On the 29th: A notable decline of -0.36% took place.
- On the 30th: The downward trend continued with a -0.09% dip.
Remarkably, out of this 11-day period, 9 days have historically seen negative returns, with only 2 days posting positive gains, one of which was nearly flat.
It's worth noting that this pattern is not an infallible rule, nor is it an exact science. Rather, it's a historical trend that has held true over many years.
While there may not be a clear explanation for why the S&P 500 tends to perform poorly during these September days, the data undeniably reflects this recurring trend. This year, the 20th and 21st of September have already followed the historical pattern, with the S&P 500 experiencing declines of -0.94% and -1.64%, respectively.
While history may not always repeat itself, it does rhyme from time to time. Therefore, it's prudent for investors to stay informed about these historical tendencies as they navigate the ever-changing landscape of the stock market.
Adobe Stock: A Decent Long-Term Buy?
Adobe (NASDAQ:ADBE), a leader in creative software, recently launched its artificial intelligence tool, Firefly, which is now integrated into Creative Cloud applications such as Photoshop and Illustrator, as well as Adobe Express and Adobe Experience Cloud.
Firefly supports text messaging in over 100 languages and enables users to create secure commercial content, including written content, images, videos, and music, using generative artificial intelligence.
Additionally, Firefly is designed to help corporate users create content without concerns about copyright infringement. Adobe has also announced a 6% to 10% increase in its Creative Cloud pricing plans, set to take effect on November 1.
Adobe is expected to reveal its earnings on December 14, with revenue projections of +10.1% in 2023 and +12.1% in 2024. Over the past year, Adobe's shares have risen by +79%, and in the last three months, they have increased by +7.60%.

Adobe currently boasts 38 ratings from analysts, with 25 indicating a "buy" recommendation, 13 suggesting a "hold," and none advising to "sell."
The market's initial favor towards Adobe has been further fueled by recent developments, pushing its potential stock price higher. Projections now range from $579 to $583, with the most optimistic outlook reaching as high as $650.
ECB Sends the Euro Tumbling
A group of European Central Bank members have expressed concern about the possibility of another interest rate hike.
Philip Lane commented on Friday that businesses were absorbing wage pressures and that the labor market was beginning to soften, suggesting that inflationary pressures resulting from wage increases may finally be easing.
As a result, the EUR/USD extended its losses to the $1.06 level, reaching its lowest point since mid-March, following the release of disappointing PMI data and the possibility that the European Central Bank could halt interest rate hikes.

Investor sentiment
Bullish sentiment, i.e. expectations that stocks will rise over the next six months, fell 3.1 percentage points to 31.3% and remains below its historical average of 37.5%.
Bearish sentiment, i.e., expectations that stocks will fall over the next six months, increased 5.4 percentage points to 34.6% and remains above its historical average of 31%.
Stock Market Rankings
Here is the year-to-date ranking of the major European and U.S. stock markets:
- Nasdaq +26.23%
- Nikkei Japanese +25.33%.
- FTSE MIB Italian +19.54%.
- Ibex 35 Spanish +14.47%
- S&P 500 +12.52%
- Dax +10.73%
- CAC +9.98%
- Euro Stoxx 50 +9.90%
- FTSE 100 British +2.12%
- Dow Jones +1.85%
***
Disclaimer: This article is written for informational purposes only; it does not constitute a solicitation, offer, advice, counsel or recommendation to invest as such it is not intended to incentivize the purchase of assets in any way. As a reminder, any type of assets, is evaluated from multiple points of view and is highly risky and therefore, any investment decision and the associated risk remains with the investor. The author does not own the stocks mentioned in the analysis.

