
Metrics to compare | INVZ | Sector Sector - Average of metrics from a broad group of related Technology sector companies | Relationship RelationshipINVZPeersSector | |
|---|---|---|---|---|
P/E Ratio | −1.2x | −2.7x | 12.5x | |
PEG Ratio | −0.10 | −0.05 | 0.01 | |
Price/Book | 1.7x | 1.6x | 2.4x | |
Price / LTM Sales | 2.2x | 6.2x | 2.2x | |
Upside (Analyst Target) | 67.0% | 197.4% | 40.5% | |
Fair Value Upside | Unlock | 6.3% | 9.2% | Unlock |
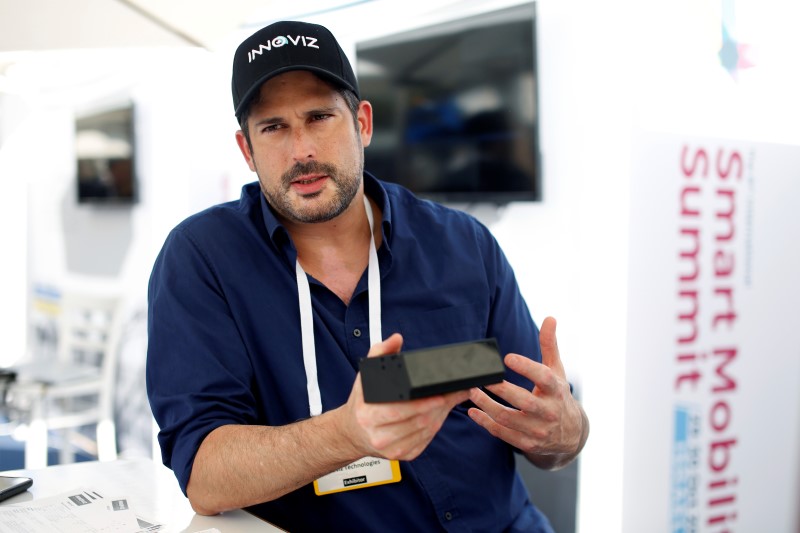
Innoviz Technologies Ltd. engages in the provision of automotive-grade LiDAR and perception solutions worldwide. Its sensors and complementary software suite are designed to deliver exceptional range, resolution, and reliability, providing accurate 3D sensing even in harsh weather conditions. The company’s offerings include InnovizTwo Short to Mid-Range, Long Range, and Ultra Long-Range a suite of automotive-grade LiDAR sensors; InnovizThree, an automotive-grade LiDAR sensor for behind-the-windshield integration; and InnovizSMART for physical AI applications, including security and defense, mobility, robotics, and traffic intelligence. Innoviz Technologies Ltd. was founded in 2016 and is headquartered in Rosh HaAyin, Israel.