EVE Energy (300014)

Currency in CNY
61.16
-0.11(-0.18%)
Closed·
300014 is not included in our AI-picked strategies. See which stocks are.
Fair Value
Day's Range
61.0262.28
52 wk Range
43.4094.44
Key Statistics
Bid/Ask
61.17 / 61.16
Prev. Close
61.27
Open
62
Day's Range
61.02-62.28
52 wk Range
43.4-94.44
Volume
44.6M
Average Volume (3m)
77.74M
1-Year Change
38.371%
Fair Value
unlockUnlock
Fair Value Upside
unlockUnlock
300014 Scorecardpro icon
Company’s Health
Unlock
Fair Value
Unlock Price
Fair Price
Upside
Price Target
84.41
Upside
+38.02%
Members' Sentiments
Bearish
Bullish
ProTips
Trading at a high P/E ratio relative to near-term earnings growth

EVE Energy News & Analysis

Show more

Technical Analysis

Summary
Strong Sell
Sell
Neutral
Buy
Strong Buy
Strong Sell
Technical Indicators
Strong Sell
Moving Averages
Strong Sell

Analyst Ratings

11 Buy
5 Hold
0 Sell
Ratings:
16 analysts
Overall Consensus
Buy

Analysts 12-Month Price Target:

Average 84.41
(+38.02% Upside)
Firm
ArticlePositionPrice TargetUpside / DownsideFrom Price TargetActionDate
Nomura/Instinet
Buy100.00+63.51%91.00MaintainApr 28, 2026
JPMorgan
Hold70.00+14.45%60.00MaintainApr 27, 2026
JPMorgan
Hold60.00-1.90%75.00MaintainJan 30, 2026
HSBC
Buy111.00+81.49%100.00MaintainDec 11, 2025
Nomura/Instinet
Buy91.00+48.79%62.00MaintainOct 24, 2025

Earnings

Latest Release
Apr 25, 2026
EPS / Forecast
0.70 / --
Revenue / Forecast
20.68B / 17.28B
EPS Revisions
Last 90 days

Dividends

Payout Ratio
Payout ratio (TTM)
Earnings retained
EPS 2.10%
Dividend Yield
0.78%
Industry Median 0.89%
Annualized payout
0.48
Paid annually
5-Years Growth
+81.32%
Growth Streak

300014 Income Statement

Compare 300014 to Peers and Sector

Metrics to compare
300014
Peers
Sector
Relationship
P/E Ratio
29.7x43.5x12.3x
PEG Ratio
4.390.380.03
Price/Book
3.0x4.7x1.4x
Price / LTM Sales
1.9x3.1x1.2x
Upside (Analyst Target)
43.7%22.8%23.7%
Fair Value Upside
Unlock4.1%6.1%Unlock

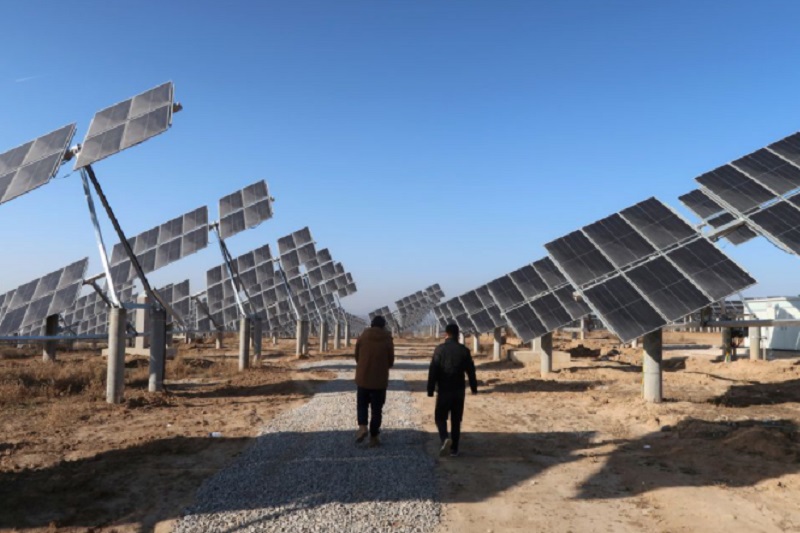
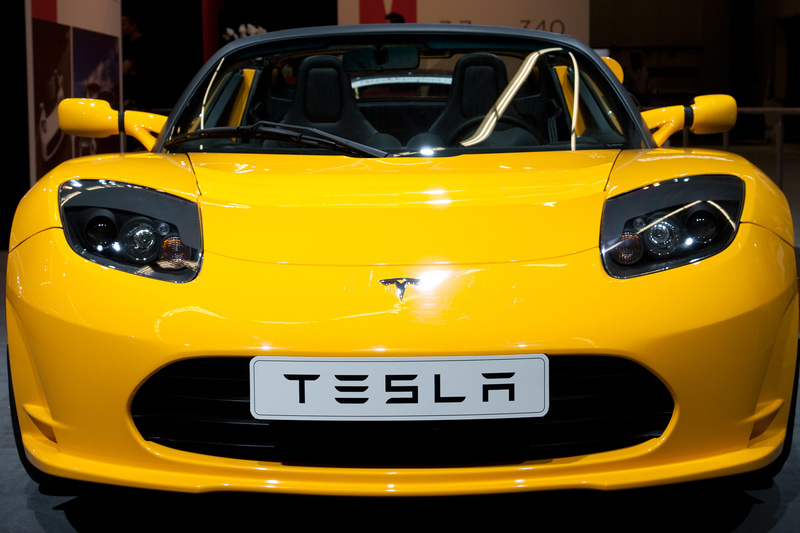
EVE Energy Co., Ltd. engages in the research, development, production, and sales of lithium batteries in China and internationally. The company provides lithium primary batteries, including lithium-thionyl chloride battery, lithium- carbamate dioxide battery, battery capacitor, and composite power supply ES. It also offers consumer batteries, such as primary lithium and consumer small lithium-ion batteries, and cylindrical cells; and power batteries, which include prismatic LFP cell, pouch NCM cell, module, battery system development, prismatic NCM cell, EV-cylindrical cell, and BMS products. In addition, the company offers IoT solutions including smart meters, smart security, consumer electronics, automotive electronics, smart city, and power tools and LEV solutions. Further, it provides energy internet solutions, such as passenger vehicles, energy storage, commercial application, and recycling. The company is also involved in exporting activities. EVE Energy Co., Ltd. was founded in 2001 and is headquartered in Huizhou, China.

Ownership

Ownership Overview

Type
Common Stock Held% of Shares OutstandingMarket Value
Mutual Funds & ETFs
409.70M18.85%25.06B
Other Institutional Investors
719.13M33.09%43.98B
Public Companies & Retail Investors
1.04B48.06%63.88B
Total
2.17B100.00%132.92B

Top Holders

Holder
% of holding
Shares Held
Date Reported
Value (In 1,000s)
Xizang Yiwei Holding Co., Ltd.29.92%650,287,98739,771,613
Hong Kong Exchanges and Clearing Limited2.55%55,354,2793,385,468

People Also Watch

72.15
300124
+5.48%
526.00
300502
+3.34%
677.77
603986
-2.45%
413.69
688012
+1.17%
8.33
601600
+1.96%

FAQ

What Is the EVE Energy (300014) Stock Price Today?

The EVE Energy stock price today is 61.16 CNY.

What Stock Exchange Does EVE Energy Trade On?

EVE Energy is listed and trades on the Shenzhen Stock Exchange.

What Is the Stock Symbol for EVE Energy?

The stock symbol for EVE Energy is "300014."

Does EVE Energy Pay Dividends? What’s The Current Dividend Yield?

The EVE Energy dividend yield is 0.78%.

What Is the EVE Energy Market Cap?

As of today, EVE Energy market cap is 132.92B CNY.

What Is EVE Energy's Earnings Per Share (TTM)?

The EVE Energy EPS (TTM) is 2.10.

When Is the Next EVE Energy Earnings Date?

EVE Energy will release its next earnings report on Aug 18, 2026.

From a Technical Analysis Perspective, Is 300014 a Buy or Sell?

Based on moving averages and other technical indicators, the daily buy/sell signal is Strong Sell.

How Many Times Has EVE Energy Stock Split?

EVE Energy has split 5 times.

How Many Employees Does EVE Energy Have?

EVE Energy has 31213 employees.

What is the current trading status of EVE Energy (300014)?

As of Jul 04, 2026, EVE Energy (300014) is trading at a price of 61.16 CNY, with a previous close of 61.27 CNY. The stock has fluctuated within a day range of 61.02 CNY to 62.28 CNY, while its 52-week range spans from 43.40 CNY to 94.44 CNY.

What Is EVE Energy (300014) Price Target According to Analysts?

The average 12-month price target for EVE Energy is 84.41 CNY, with a high estimate of 109 CNY and a low estimate of 46 CNY. 11 analysts recommend buying the stock, while 0 suggest selling, leading to an overall rating of Buy. The stock has an +38.02% Upside potential.
Risk Disclosure: Trading in financial instruments and/or cryptocurrencies involves high risks including the risk of losing some, or all, of your investment amount, and may not be suitable for all investors. Prices of cryptocurrencies are extremely volatile and may be affected by external factors such as financial, regulatory or political events. Trading on margin increases the financial risks.
Before deciding to trade in financial instrument or cryptocurrencies you should be fully informed of the risks and costs associated with trading the financial markets, carefully consider your investment objectives, level of experience, and risk appetite, and seek professional advice where needed.
Fusion Media would like to remind you that the data contained in this website is not necessarily real-time nor accurate. The data and prices on the website are not necessarily provided by any market or exchange, but may be provided by market makers, and so prices may not be accurate and may differ from the actual price at any given market, meaning prices are indicative and not appropriate for trading purposes. Fusion Media and any provider of the data contained in this website will not accept liability for any loss or damage as a result of your trading, or your reliance on the information contained within this website.
It is prohibited to use, store, reproduce, display, modify, transmit or distribute the data contained in this website without the explicit prior written permission of Fusion Media and/or the data provider. All intellectual property rights are reserved by the providers and/or the exchange providing the data contained in this website.
Fusion Media may be compensated by the advertisers that appear on the website, based on your interaction with the advertisements or advertisers.
© 2007-2026 - Fusion Media Limited. All Rights Reserved.