Marks and Spencer Group PLC (MKS)

Currency in GBP
348.70
+0.10(+0.03%)
Real-time Data·
MKS is not included in our AI-picked strategies. See which stocks are.
Fair Value
Day's Range
343.50354.30
52 wk Range
301.50411.30
Key Statistics
Bid/Ask
348.50 / 348.90
Prev. Close
348.5
Open
345.9
Day's Range
343.5-354.3
52 wk Range
301.5-411.3
Volume
394.68K
Average Volume (3m)
8.16M
1-Year Change
-6.7654%
Fair Value
unlockUnlock
Fair Value Upside
unlockUnlock
MKS Scorecardpro icon
Company’s Health
Unlock
Fair Value
Unlock Price
Fair Price
Upside
Price Target
420.24
Upside
+20.51%
Members' Sentiments
Bearish
Bullish
ProTips
Analysts anticipate sales growth in the current year
Show more

Technical Analysis

Summary
Strong Sell
Sell
Neutral
Buy
Strong Buy
Strong Buy
Technical Indicators
Strong Buy
Moving Averages
Strong Buy

Analyst Ratings

15 Buy
3 Hold
0 Sell
Ratings:
18 analysts
Overall Consensus
Buy

Analysts 12-Month Price Target:

Average 420.24
(+20.51% Upside)
Firm
ArticlePositionPrice TargetUpside / DownsideFrom Price TargetActionDate
Morgan Stanley
Buy4.39+25.51%-New CoverageMay 18, 2026
Bernstein SocGen Group
Buy4.40+25.79%-New CoverageMay 14, 2026
UBS
Buy4.25+21.50%4.35MaintainMar 27, 2026
Barclays
Buy4.00+14.36%4.20MaintainMar 20, 2026
Citi
Buy4.30+22.93%4.35MaintainMar 19, 2026

Marks and Spencer Group PLC Earnings Call Summary for H2/2026

  • Total group sales reached £17.4B, up 20%+ YoY driven by Ocado Retail consolidation; excluding Ocado, sales rose 1.9% to £14.2B.
  • Food segment demonstrated resilience with 7% sales growth, while fashion/home/beauty declined 7.7% YoY due to stock flow disruptions.
  • Adjusted pre-tax profit of £671.4M; free cash flow of £131.3M with net funds position of £338M excluding lease liabilities.
  • Company targets £600M cost savings by FY28; EPS forecast at $2.57 for FY26-27 despite cyber incident impact on H1 operations.
  • CEO Machin emphasized strong H2 recovery from April 2024 cyberattack, focusing on operational efficiency and food store network expansion.
Last Updated: 2026-05-20, 03:30 a/m
Read Full Transcript

Earnings

Latest Release
May 20, 2026
EPS / Forecast
0.18 / 0.16
Revenue / Forecast
9.65B / 9.58B
EPS Revisions
Last 90 days

Dividends

Payout Ratio
Payout ratio (TTM)
Earnings retained
EPS 0.13%
Dividend Yield
1.09%
Industry Median 3.48%
Annualized payout
3.80
Paid unevenly
5-Years Growth
-0.52%
Growth Streak

MKS Income Statement

Compare MKS to Peers and Sector

Metrics to compare
MKS
Peers
Sector
Relationship
P/E Ratio
27.2x20.1x11.7x
PEG Ratio
−3.480.260.03
Price/Book
2.3x2.5x1.5x
Price / LTM Sales
0.4x0.5x0.9x
Upside (Analyst Target)
33.4%26.5%24.7%
Fair Value Upside
Unlock25.3%12.9%Unlock

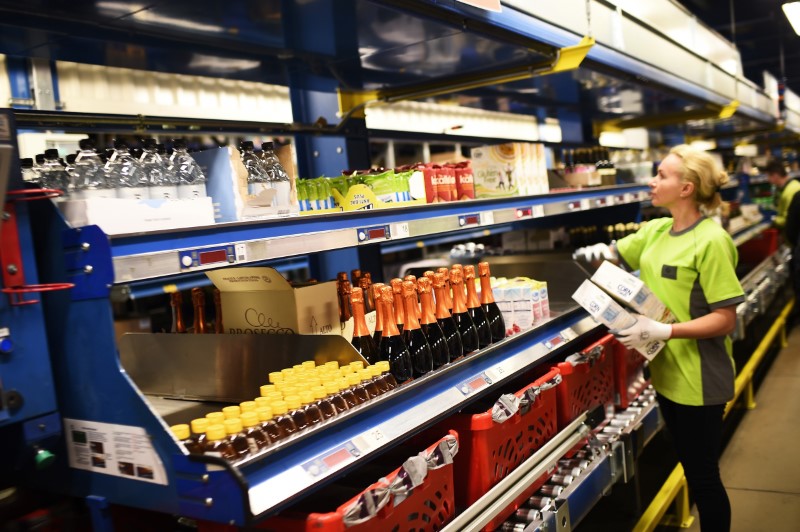
Marks and Spencer Group plc operates various retail stores. It operates through Fashion, Home & Beauty; Food; International; and Ocado segments. The company offers womenswear, menswear, lingerie, kids wear, beauty and home products through UK and ROI retail stores and online. It also provides meat, fish, protein deli and dairy; produce and horticulture; meals, frozen, and food on the move; core basket; beers, wines, and spirits; and impulse and events, and hospitality services. In addition, it operates international franchises; and provides banking services. The company also exports its products. The company was founded in 1884 and is based in London, the United Kingdom.

Ownership

Ownership Overview

Type
Common Stock Held% of Shares OutstandingMarket Value
Mutual Funds & ETFs
945.37M46.67%3.29B
Other Institutional Investors
714.24M35.26%2.49B
Public Companies & Retail Investors
365.96M18.07%1.28B
Total
2.03B100.00%7.06B

Top Holders

Holder
% of holding
Shares Held
Date Reported
Value (In 1,000s)
The Vanguard Group, Inc.5.19%105,177,241343,719
RWC Partners Limited4.49%91,016,859297,443

People Also Watch

877.40
SGE
-2.19%
194.20
CNA
-0.28%
78.74
TW
+0.25%
1,496.50
SMT
+1.80%
310.30
SBRY
+0.06%

FAQ

What Is the Marks & Spencer (MKS) Stock Price Today?

The Marks & Spencer stock price today is 348.70 GBP.

What Stock Exchange Does Marks & Spencer Trade On?

Marks & Spencer is listed and trades on the London Stock Exchange.

What Is the Stock Symbol for Marks & Spencer?

The stock symbol for Marks & Spencer is "MKS."

Does Marks & Spencer Pay Dividends? What’s The Current Dividend Yield?

The Marks & Spencer dividend yield is 1.09%.

What Is the Marks & Spencer Market Cap?

As of today, Marks & Spencer market cap is 7.17B GBP.

What Is Marks & Spencer's Earnings Per Share (TTM)?

The Marks & Spencer EPS (TTM) is 0.13.

When Is the Next Marks & Spencer Earnings Date?

Marks & Spencer will release its next earnings report on May 20, 2026.

From a Technical Analysis Perspective, Is MKS a Buy or Sell?

Based on moving averages and other technical indicators, the daily buy/sell signal is Strong Buy.

How Many Times Has Marks & Spencer Stock Split?

Marks & Spencer has split 1 times.

How Many Employees Does Marks & Spencer Have?

Marks & Spencer has 64000 employees.

What is the current trading status of Marks & Spencer (MKS)?

As of May 21, 2026, Marks & Spencer (MKS) is trading at a price of 348.70 GBP, with a previous close of 348.50 GBP. The stock has fluctuated within a day range of 343.50 GBP to 354.30 GBP, while its 52-week range spans from 301.50 GBP to 411.30 GBP.

What Is Marks & Spencer (MKS) Price Target According to Analysts?

The average 12-month price target for Marks & Spencer is 420.24 GBP, with a high estimate of 462 GBP and a low estimate of 342 GBP. 15 analysts recommend buying the stock, while 0 suggest selling, leading to an overall rating of Buy. The stock has an +20.51% Upside potential.
Risk Disclosure: Trading in financial instruments and/or cryptocurrencies involves high risks including the risk of losing some, or all, of your investment amount, and may not be suitable for all investors. Prices of cryptocurrencies are extremely volatile and may be affected by external factors such as financial, regulatory or political events. Trading on margin increases the financial risks.
Before deciding to trade in financial instrument or cryptocurrencies you should be fully informed of the risks and costs associated with trading the financial markets, carefully consider your investment objectives, level of experience, and risk appetite, and seek professional advice where needed.
Fusion Media would like to remind you that the data contained in this website is not necessarily real-time nor accurate. The data and prices on the website are not necessarily provided by any market or exchange, but may be provided by market makers, and so prices may not be accurate and may differ from the actual price at any given market, meaning prices are indicative and not appropriate for trading purposes. Fusion Media and any provider of the data contained in this website will not accept liability for any loss or damage as a result of your trading, or your reliance on the information contained within this website.
It is prohibited to use, store, reproduce, display, modify, transmit or distribute the data contained in this website without the explicit prior written permission of Fusion Media and/or the data provider. All intellectual property rights are reserved by the providers and/or the exchange providing the data contained in this website.
Fusion Media may be compensated by the advertisers that appear on the website, based on your interaction with the advertisements or advertisers.
© 2007-2026 - Fusion Media Limited. All Rights Reserved.