* U.S. stocks down in late-morning trading
* China Dec exports, imports unexpectedly drop
* U.S. Treasury yields on most maturities slipped
By Caroline Valetkevitch
NEW YORK, Jan 14 (Reuters) - World stock indexes fell while the yen rose against the dollar on Monday after a shock contraction in Chinese trade reignited fears of a sharper slowdown in global growth and caused investors to sell riskier assets.
Copper prices fell and the Australian and New Zealand dollars also declined following the China news, which added to worries that U.S. tariffs on Chinese goods were taking a toll on the world's second-largest economy. biggest theme (in the market today) is risk-off," said John Doyle, vice president of dealing and trading at Tempus, Inc.
Data from China showed imports fell 7.6 percent year-on-year in December while analysts had predicted a 5-percent rise. Exports dropped 4.4 percent, confounding expectations for a 3-percent gain. an interactive version of the following chart, click here https://tmsnrt.rs/2SRopIf.
The United States and China - the world's two largest economies - have been in talks for months to try and resolve their bitter trade war, with no signs of substantial progress. to the gloom were weak industrial output numbers from the euro zone, which showed the largest fall in nearly three years. demand has been felt around the world with sales of goods ranging from iPhones to automobiles slowing, prompting profit warnings from Apple AAPL.O among others. shares fell, including Boeing (NYSE:BA) Co BA.N Caterpillar Inc (NYSE:CAT) CAT.N , though U.S. stock investors also were on edge as the U.S. earnings season kicked off. seeing some cautiousness heading into the beginning of earnings season as people are worried about guidance and what companies are going to say, especially in relation to trade," said Robert Pavlik, chief investment strategist and senior portfolio manager at SlateStone Wealth LLC in New York.
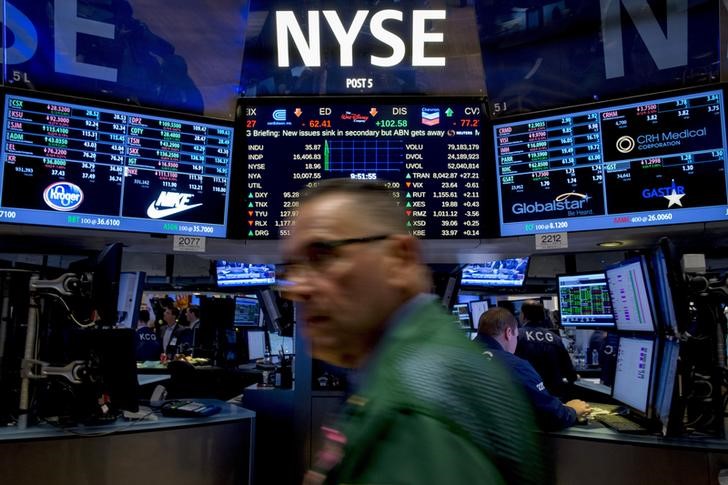
The Dow Jones Industrial Average .DJI fell 139.63 points, or 0.58 percent, to 23,856.32, the S&P 500 .SPX lost 16.99 points, or 0.65 percent, to 2,579.27 and the Nasdaq Composite .IXIC dropped 63.27 points, or 0.91 percent, to 6,908.21.
Citigroup Inc (NYSE:C) C.N shares were higher after the bank beat profit estimates as lower expenses offset a drop in quarterly revenue. pan-European STOXX 600 index .STOXX lost 0.38 percent and MSCI's gauge of stocks across the globe .MIWD00000PUS shed 0.62 percent.
U.S. Treasuries tracked the European bond market, but were little changed in late-morning U.S. trading. the foreign exchange market, the Japanese yen JPY= , a safe-haven currency that benefits in times of geopolitical turmoil, strengthened against the U.S. dollar by 0.33 percent. Australian dollar AUD= , which was down 0.24 percent, and kiwi dollar NZD= , which was down 0.12 percent. China is Australia's largest trade partner.
COMMODITIES SUFFER
The prospect of slowing global growth also roiled some commodity markets. Industrial metals copper CMCU3 and aluminium lost ground in London and Shanghai. MET/L
Three-month copper on the London Metal Exchange CMCU3 was bid down 0.9 percent at $5,888 a tonne after failing to trade in official rings, its lowest level in more than a week.
Oil prices were down slightly. U.S. crude CLcv1 fell 0.54 percent to $51.31 per barrel. Brent crude LCOc1 , the international benchmark, fell 46 cents to $60.02 a barrel. China trade shock png
https://tmsnrt.rs/2SYCUu9 China trade shock interactive
https://tmsnrt.rs/2SRopIf GRAPHIC-Global assets in 2018
http://tmsnrt.rs/2jvdmXl GRAPHIC-World FX rates in 2018
http://tmsnrt.rs/2egbfVh GRAPHIC-Emerging markets in 2018
http://tmsnrt.rs/2ihRugV GRAPHIC-MSCI All Country World Index Market Cap
http://tmsnrt.rs/2EmTD6j GRAPHIC-The rolling bear market
https://tmsnrt.rs/2QCzyvm
^^^^^^^^^^^^^^^^^^^^^^^^^^^^^^^^^^^^^^^^^^^^^^^^^^^^^^^^^^^>